• Login
Crypto Newsmart
No Result
View All Result
  • HOME
  • BITCOIN
  • CRYPTO UPDATES
    • ALTCOIN
    • ETEREUM
    • NFT’s
    • CRYPTO PRICE ANALYSIS
  • LEARN CRYPTO
  • CRYPTO EXCHANGES
  • BLOCKCHAIN
  • MINING
  • SCAM ALERT
  • PRESS RELEASE
  • HOME
  • BITCOIN
  • CRYPTO UPDATES
    • ALTCOIN
    • ETEREUM
    • NFT’s
    • CRYPTO PRICE ANALYSIS
  • LEARN CRYPTO
  • CRYPTO EXCHANGES
  • BLOCKCHAIN
  • MINING
  • SCAM ALERT
  • PRESS RELEASE
No Result
View All Result
Crypto Newsmart
No Result
View All Result

Dogecoin May Face An ‘Ugly’ Drop Before The Weekend: Analyst

Crypto Newsmart by Crypto Newsmart
3 months ago
in Crypto Price Analysis
Reading Time: 3 mins read
11
VIEWS
Share on Facebook


Este artículo también está disponible en español.

In a freshly shared four-hour chart of the DOGE/USDT trading pair on Binance, crypto analyst Carlos Garcia Tapia warns of potential downside for Dogecoin as weekend trading approaches. “If bears break this pattern, it’ll get ugly… especially since the weekend is coming,” Tapia warns.

Dogecoin Price Crash Incoming?

His chart posted via X depicts an ascending wedge formation running into a confluence of resistance between $0.338 and $0.343, as well as a notable support zone in the $0.31 region.

The chart highlights higher lows (marked as “LL” on the chart) forming the lower boundary of an ascending wedge. Meanwhile, overhead resistance (a rectangular zone around $0.338–$0.343) has repeatedly capped upward price movements. This wedge appears to be compressing price action—often a setup for a significant breakout or breakdown.

DOGE price analysis
Dogecoin price analysis, 4-hour chart | Source: X @CAGThe3rd

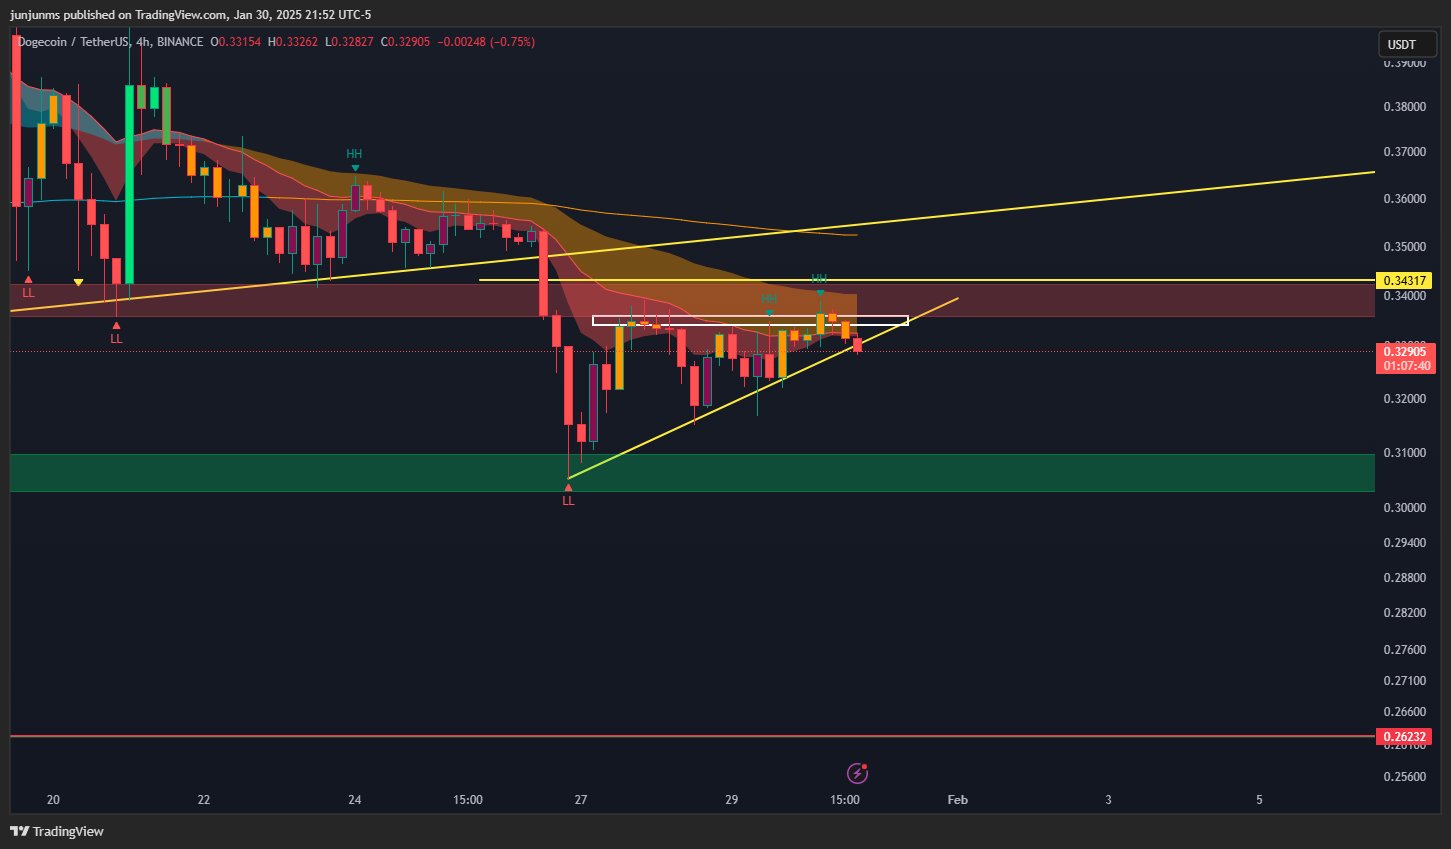
A horizontal resistance zone around $0.34 stands out. DOGE’s price has attempted multiple short-term moves above this level but failed to secure a confirmed breakout, suggesting sellers are firmly defending that zone.

Related Reading

On the downside, a green box spanning roughly $0.310 marks an area where buying interest has historically picked up. Below that level, the chart references a lower support marker near $0.262, indicating a more substantial potential drop if the wedge pattern breaks down decisively.

The analyst specifically points to the upcoming weekend as a wildcard. Historically, lower trading volumes on Saturdays and Sundays can exacerbate volatility. If Dogecoin fails to hold its rising trend line—currently near $0.328–$0.330—and liquidity thins out, the price could swiftly test the lower support around $0.310, or potentially slide toward the $0.262 zone if the selling momentum accelerates.

Related Reading

While a breakout above $0.343 could invalidate this bearish setup, Tapia’s cautionary note underscores the significance of a potential breakdown from the wedge formation. Weekend price action often diverges from midweek patterns due to reduced participation, meaning a sharp move in either direction could unfold more quickly than usual.

DOGE Needs To Hold $0.31

The daily chart supports Tapia’s thesis. There, Dogecoin (DOGE) finds itself under intensifying downward pressure as price action hugs a persistent downtrend line. After hitting a local high in December, DOGE has retreated below key exponential moving averages (EMAs). The 20-day EMA (currently at approximately $0.3457) and the 50-day EMA (near $0.3473) have both curved lower, signaling waning short-term momentum.

Dogecoin price
DOGE price, 1-day chart | Source: DOGEUSDT on Tradingview.com

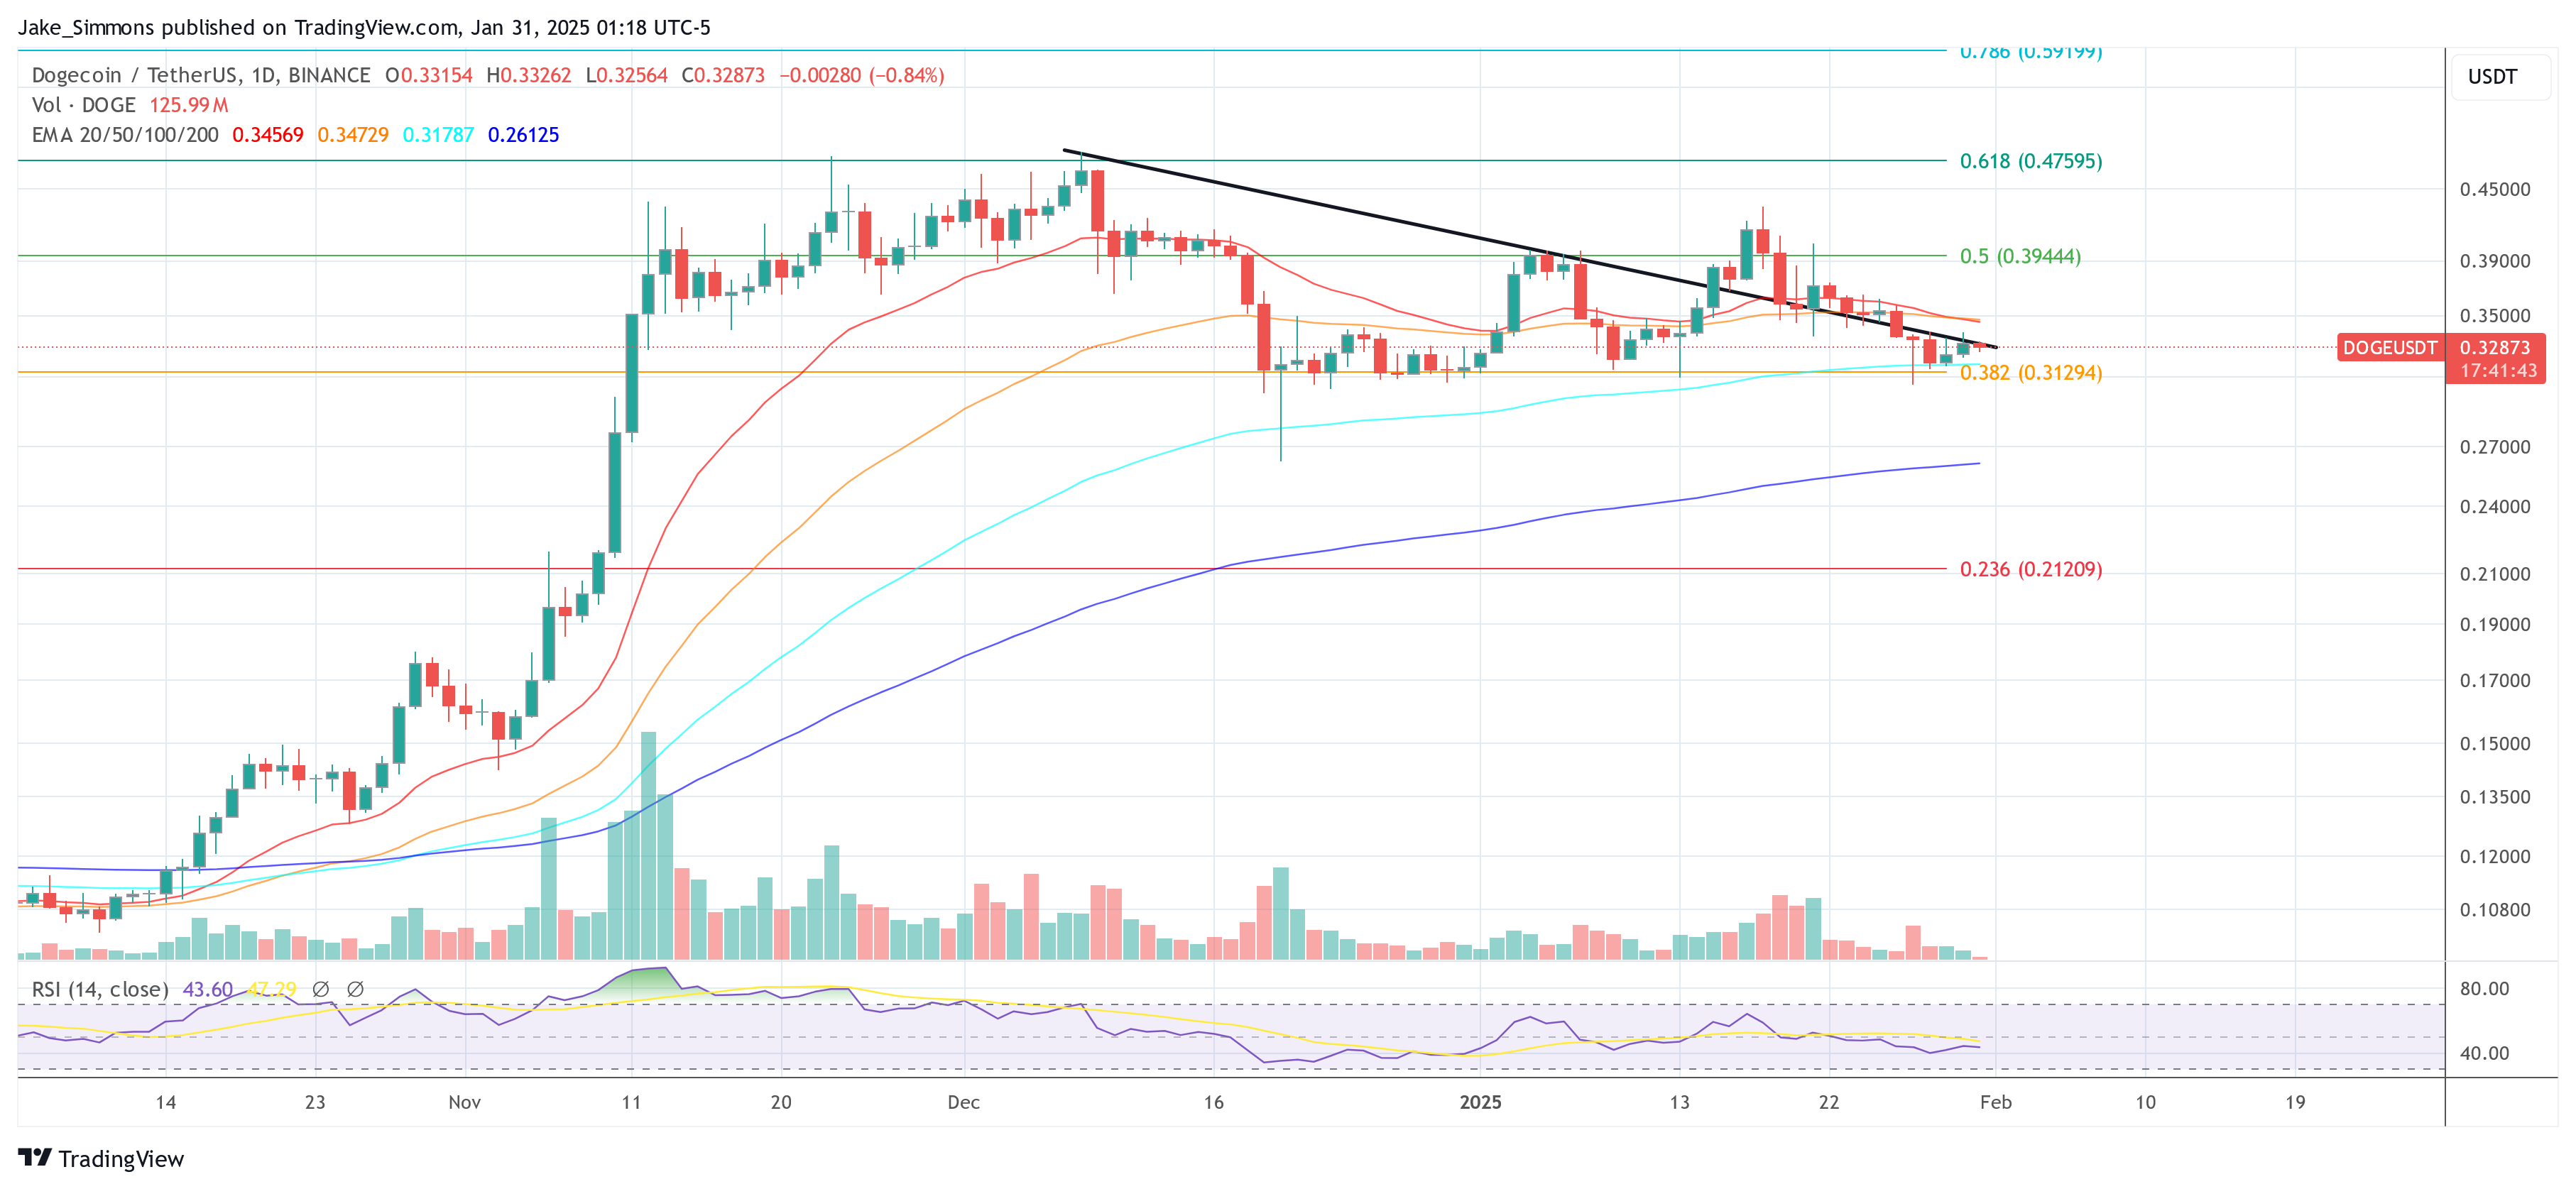
A glance at the chart reveals that DOGE is now just slightly above the 0.382 Fibonacci retracement level, calculated around $0.313. This Fib zone has acted as the most crucial support since mid-December, but any decisive daily close beneath it could accelerate selling. Traders are keeping a close eye on the 100-day EMA (around $0.3179), which is sandwiched just above this Fib level.

If the price fails to defend the area between $0.313 and $0.317, then eyes will turn to the 200-day EMA at roughly $0.2613 as a critical long-term support. If this level breaks to the downside as well, the 0.236 Fib at $0.212 could quickly become a reality.

Featured image created with DALL.E, chart from TradingView.com


Source link

Related Posts

Is a Bitcoin Rally Coming? Exchange Net Flow Data Suggests So
Crypto Price Analysis

Is a Bitcoin Rally Coming? Exchange Net Flow Data Suggests So

28 March 2025
Ethereum Price Hits 300-Week MA For The Second Time Ever, Here’s What Happened In 2022
Crypto Price Analysis

Ethereum Price Hits 300-Week MA For The Second Time Ever, Here’s What Happened In 2022

28 March 2025
Investors Withdraw 360,000 Ethereum From Exchanges In Just 48 Hours – Accumulation Trend?
Crypto Price Analysis

Investors Withdraw 360,000 Ethereum From Exchanges In Just 48 Hours – Accumulation Trend?

21 March 2025
XRP Coils For A Breakout, But Key Resistance Still Stalls The Rally
Crypto Price Analysis

XRP Coils For A Breakout, But Key Resistance Still Stalls The Rally

18 March 2025
Chainlink Price Shows Signs Of Recovery — Why  Is The Level To Watch
Crypto Price Analysis

Chainlink Price Shows Signs Of Recovery — Why $15 Is The Level To Watch

15 March 2025
BNB Bulls Take Charge: Price Rebounds Strongly After Recent Dip
Crypto Price Analysis

BNB Bulls Take Charge: Price Rebounds Strongly After Recent Dip

11 March 2025

[convertful id="153816"]

by CurrencyRate.Today
  • Home
  • Disclaimer
  • Privacy Policy
  • Digital Millennium Copyright Act Policy (DMCA)
  • Cookie Privacy Policy
  • Terms and Conditions
  • Contact us
CRYPTO NEWSMART

Copyright © 2021 Crypto Newsmart.

No Result
View All Result
  • HOME
  • BITCOIN
  • CRYPTO UPDATES
    • ALTCOIN
    • ETEREUM
    • NFT’s
    • CRYPTO PRICE ANALYSIS
  • LEARN CRYPTO
  • CRYPTO EXCHANGES
  • BLOCKCHAIN
  • MINING
  • SCAM ALERT
  • PRESS RELEASE

Copyright © 2021 Crypto Newsmart.

Welcome Back!

Login to your account below

Forgotten Password?

Retrieve your password

Please enter your username or email address to reset your password.

Log In
Manage Cookie Consent

We use cookies to optimise our website and our service.

Functional Always active
The technical storage or access is strictly necessary for the legitimate purpose of enabling the use of a specific service explicitly requested by the subscriber or user, or for the sole purpose of carrying out the transmission of a communication over an electronic communications network.
Preferences
The technical storage or access is necessary for the legitimate purpose of storing preferences that are not requested by the subscriber or user.
Statistics
The technical storage or access that is used exclusively for statistical purposes. The technical storage or access that is used exclusively for anonymous statistical purposes. Without a subpoena, voluntary compliance on the part of your Internet Service Provider, or additional records from a third party, information stored or retrieved for this purpose alone cannot usually be used to identify you.
Marketing
The technical storage or access is required to create user profiles to send advertising, or to track the user on a website or across several websites for similar marketing purposes.
Manage options Manage services Manage {vendor_count} vendors Read more about these purposes
Preferences
{title} {title} {title}