

On-chain data suggests a majority of the Bitcoin exchange inflows are currently coming from investors holding their coins at a loss.
Bitcoin Exchange Inflow Volume Is Tending Towards Losses Right Now
According to data from the on-chain analytics firm Glassnode, the short-term holders are mostly contributing to these loss inflows. The “exchange inflow” is an indicator that measures the total amount of Bitcoin that’s currently flowing into the wallets of centralized exchanges.
Generally, investors deposit to these platforms whenever want to sell, so a large amount of inflows can be a sign that a selloff is going on in the BTC market right now. Low values of the metric, on the other hand, imply holders may not be participating in much selling at the moment, which can be bullish for the price.
In the context of the current discussion, the exchange inflow itself isn’t of relevance; a related metric called the “exchange inflow volume profit/loss bias” is. As this indicator’s name already suggests, it tells us whether the inflows going to exchanges are coming from profit or loss holders currently.
When this metric has a value greater than 1, it means the majority of the inflow volume contains coins that their holders had been carrying at a profit. Similarly, values under the threshold imply a dominance of the loss volume.
Now, here is a chart that shows the trend in the Bitcoin exchange inflow profit/loss bias over the last few years:
The value of the metric seems to have observed some decline in recent days | Source: Glassnode on Twitter
As shown in the above graph, the Bitcoin exchange inflow volume profit/loss bias has had a value above 1 for most of the ongoing rallies that started back in January of this year.
This suggests that most of the exchange inflows in this period have come from the profit holders. This naturally makes sense, as any rally generally entices a large number of holders to sell and harvest their gains.
There have been a couple of exceptional instances, however. The first was back in March when the asset’s price plunged below the $20,000 level. The bias in the market shifted towards loss selling then, implying that some investors who bought around the local top had started capitulating.
A similar pattern has also occurred recently, as the cryptocurrency’s price has stumbled below the $27,000 level. Following this plunge, the indicator’s value has come down to just 0.70.
Further data from Glassnode reveals that the bias of the long-term holders (LTHs), the investors holding their coins since at least 155 days ago, have actually leaned towards profits recently.
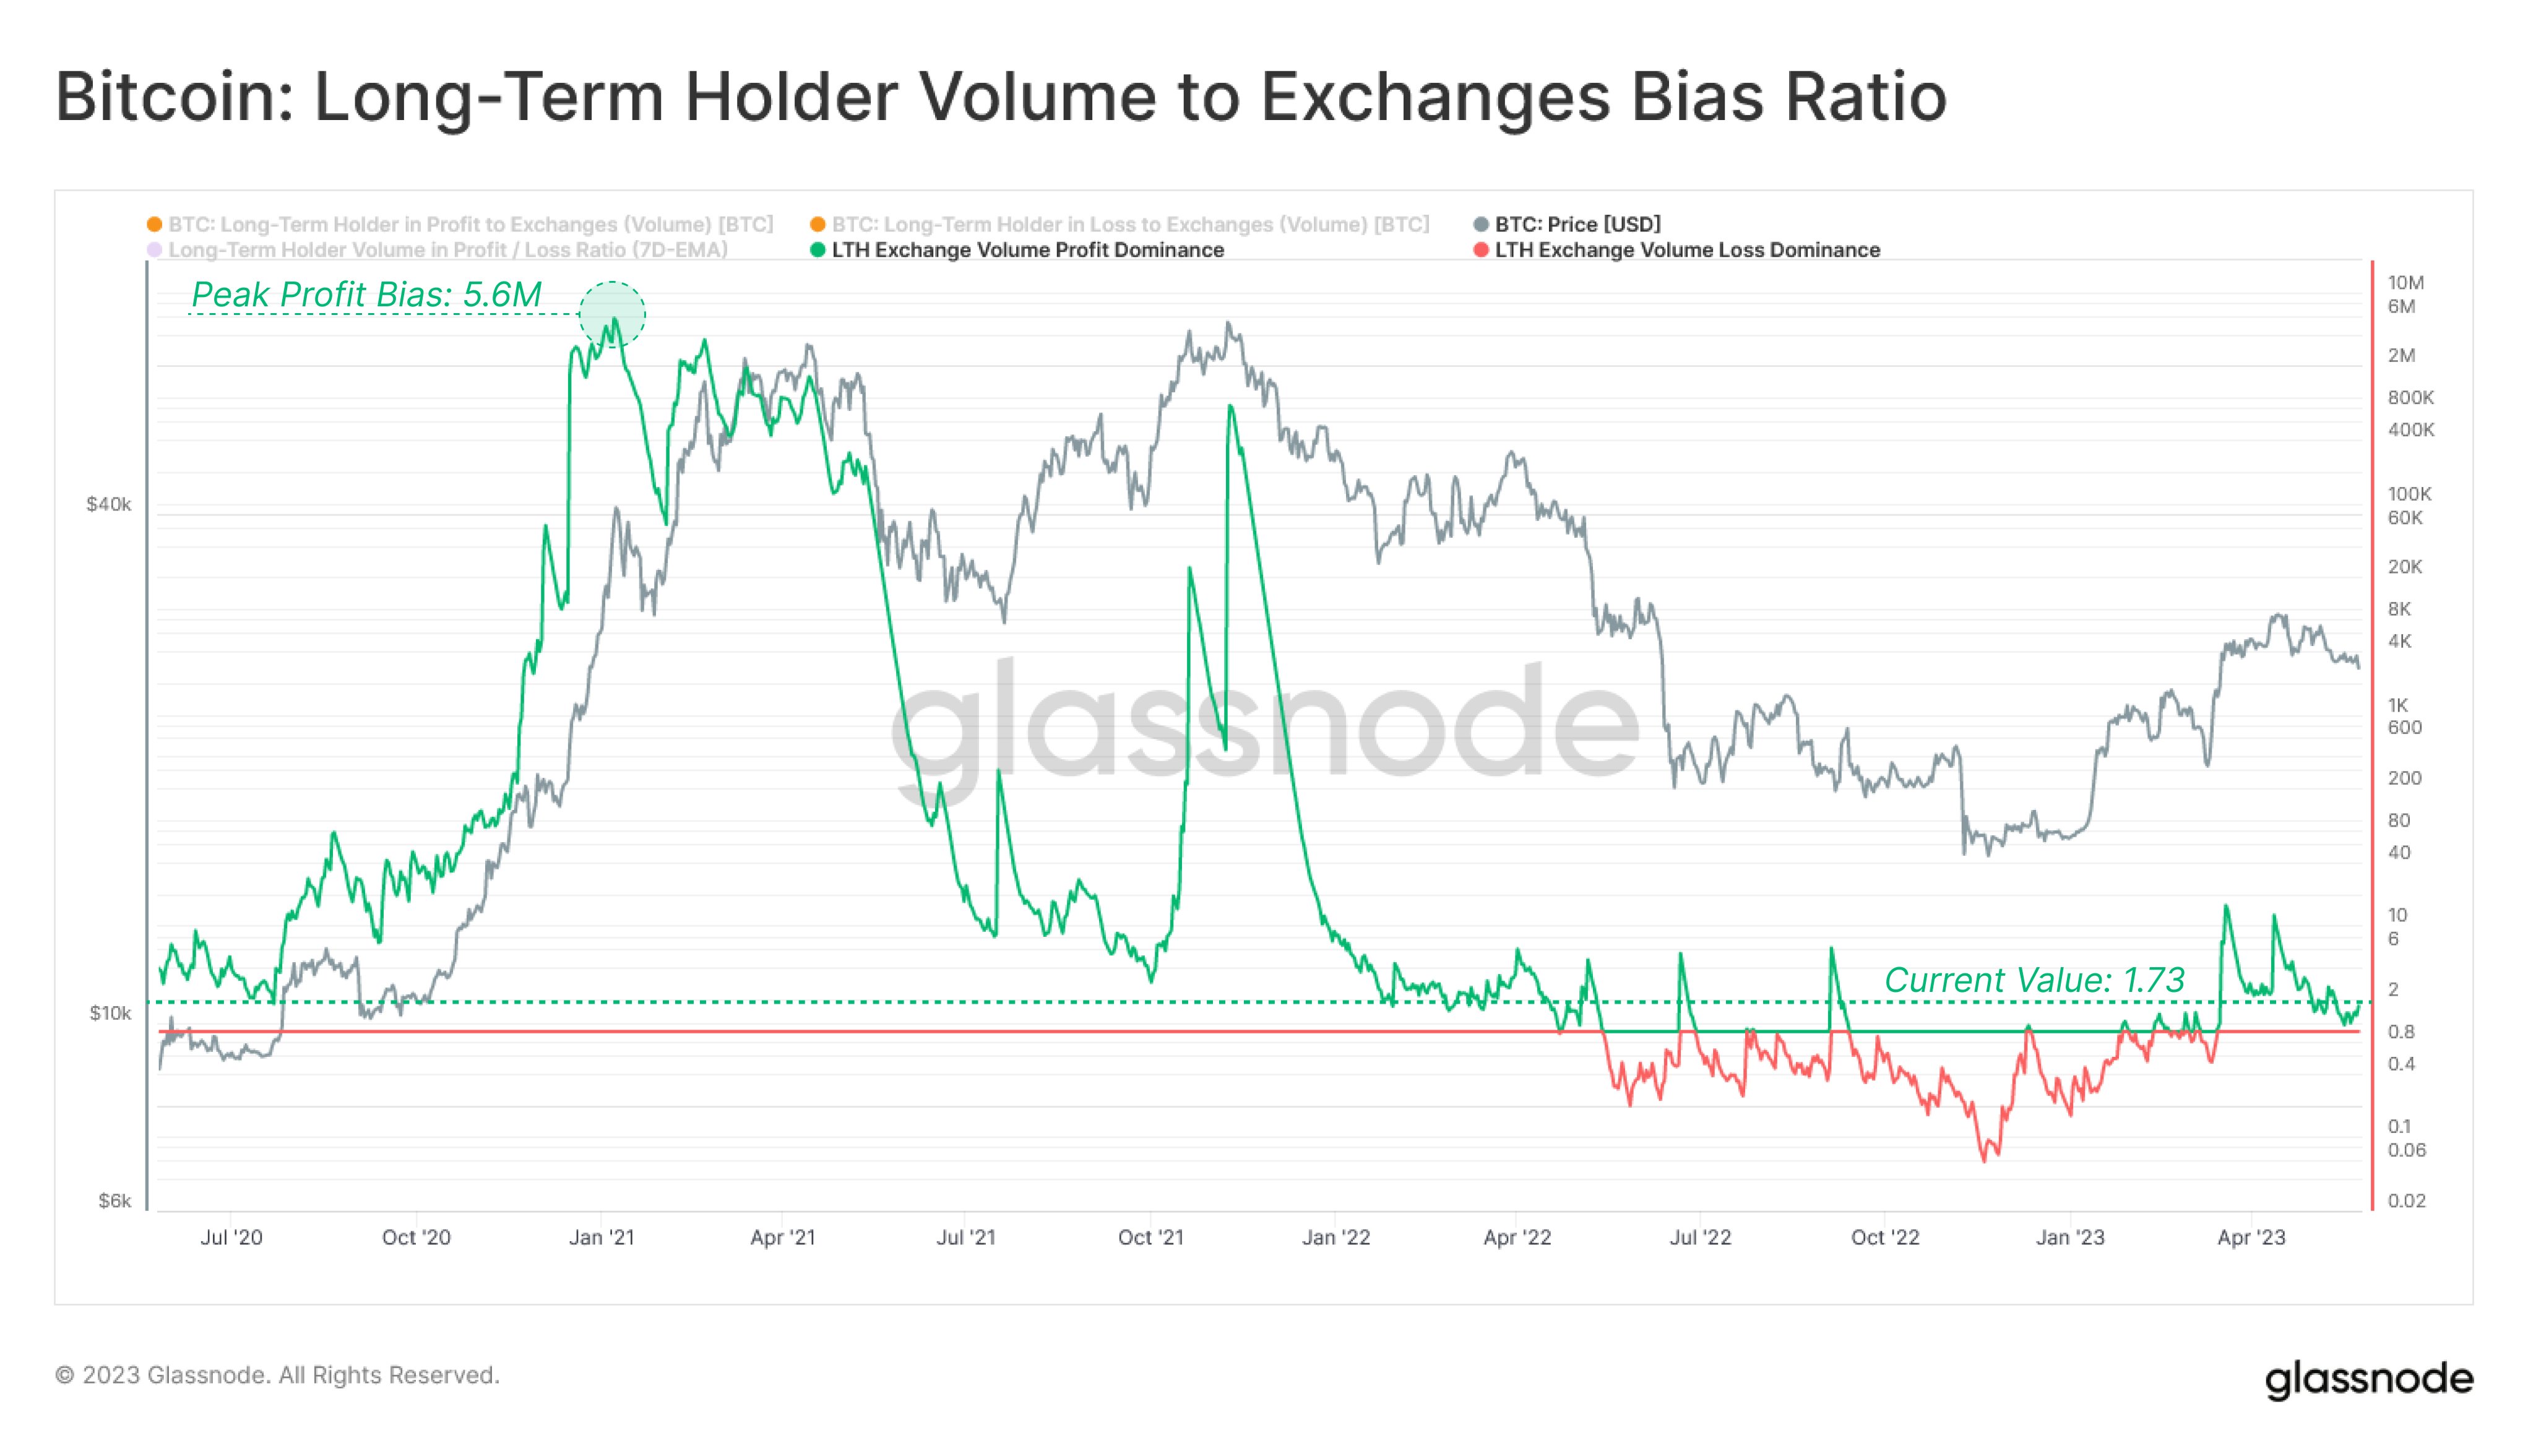
Looks like the indicator has a positive value right now | Source: Glassnode on Twitter
From the chart, it’s visible that the indicator has a value of 1.73 for the LTHs, implying a strong bias toward profits. Naturally, if the LTHs haven’t been selling at a loss, the opposite cohort must be the short-term holders (STHs).
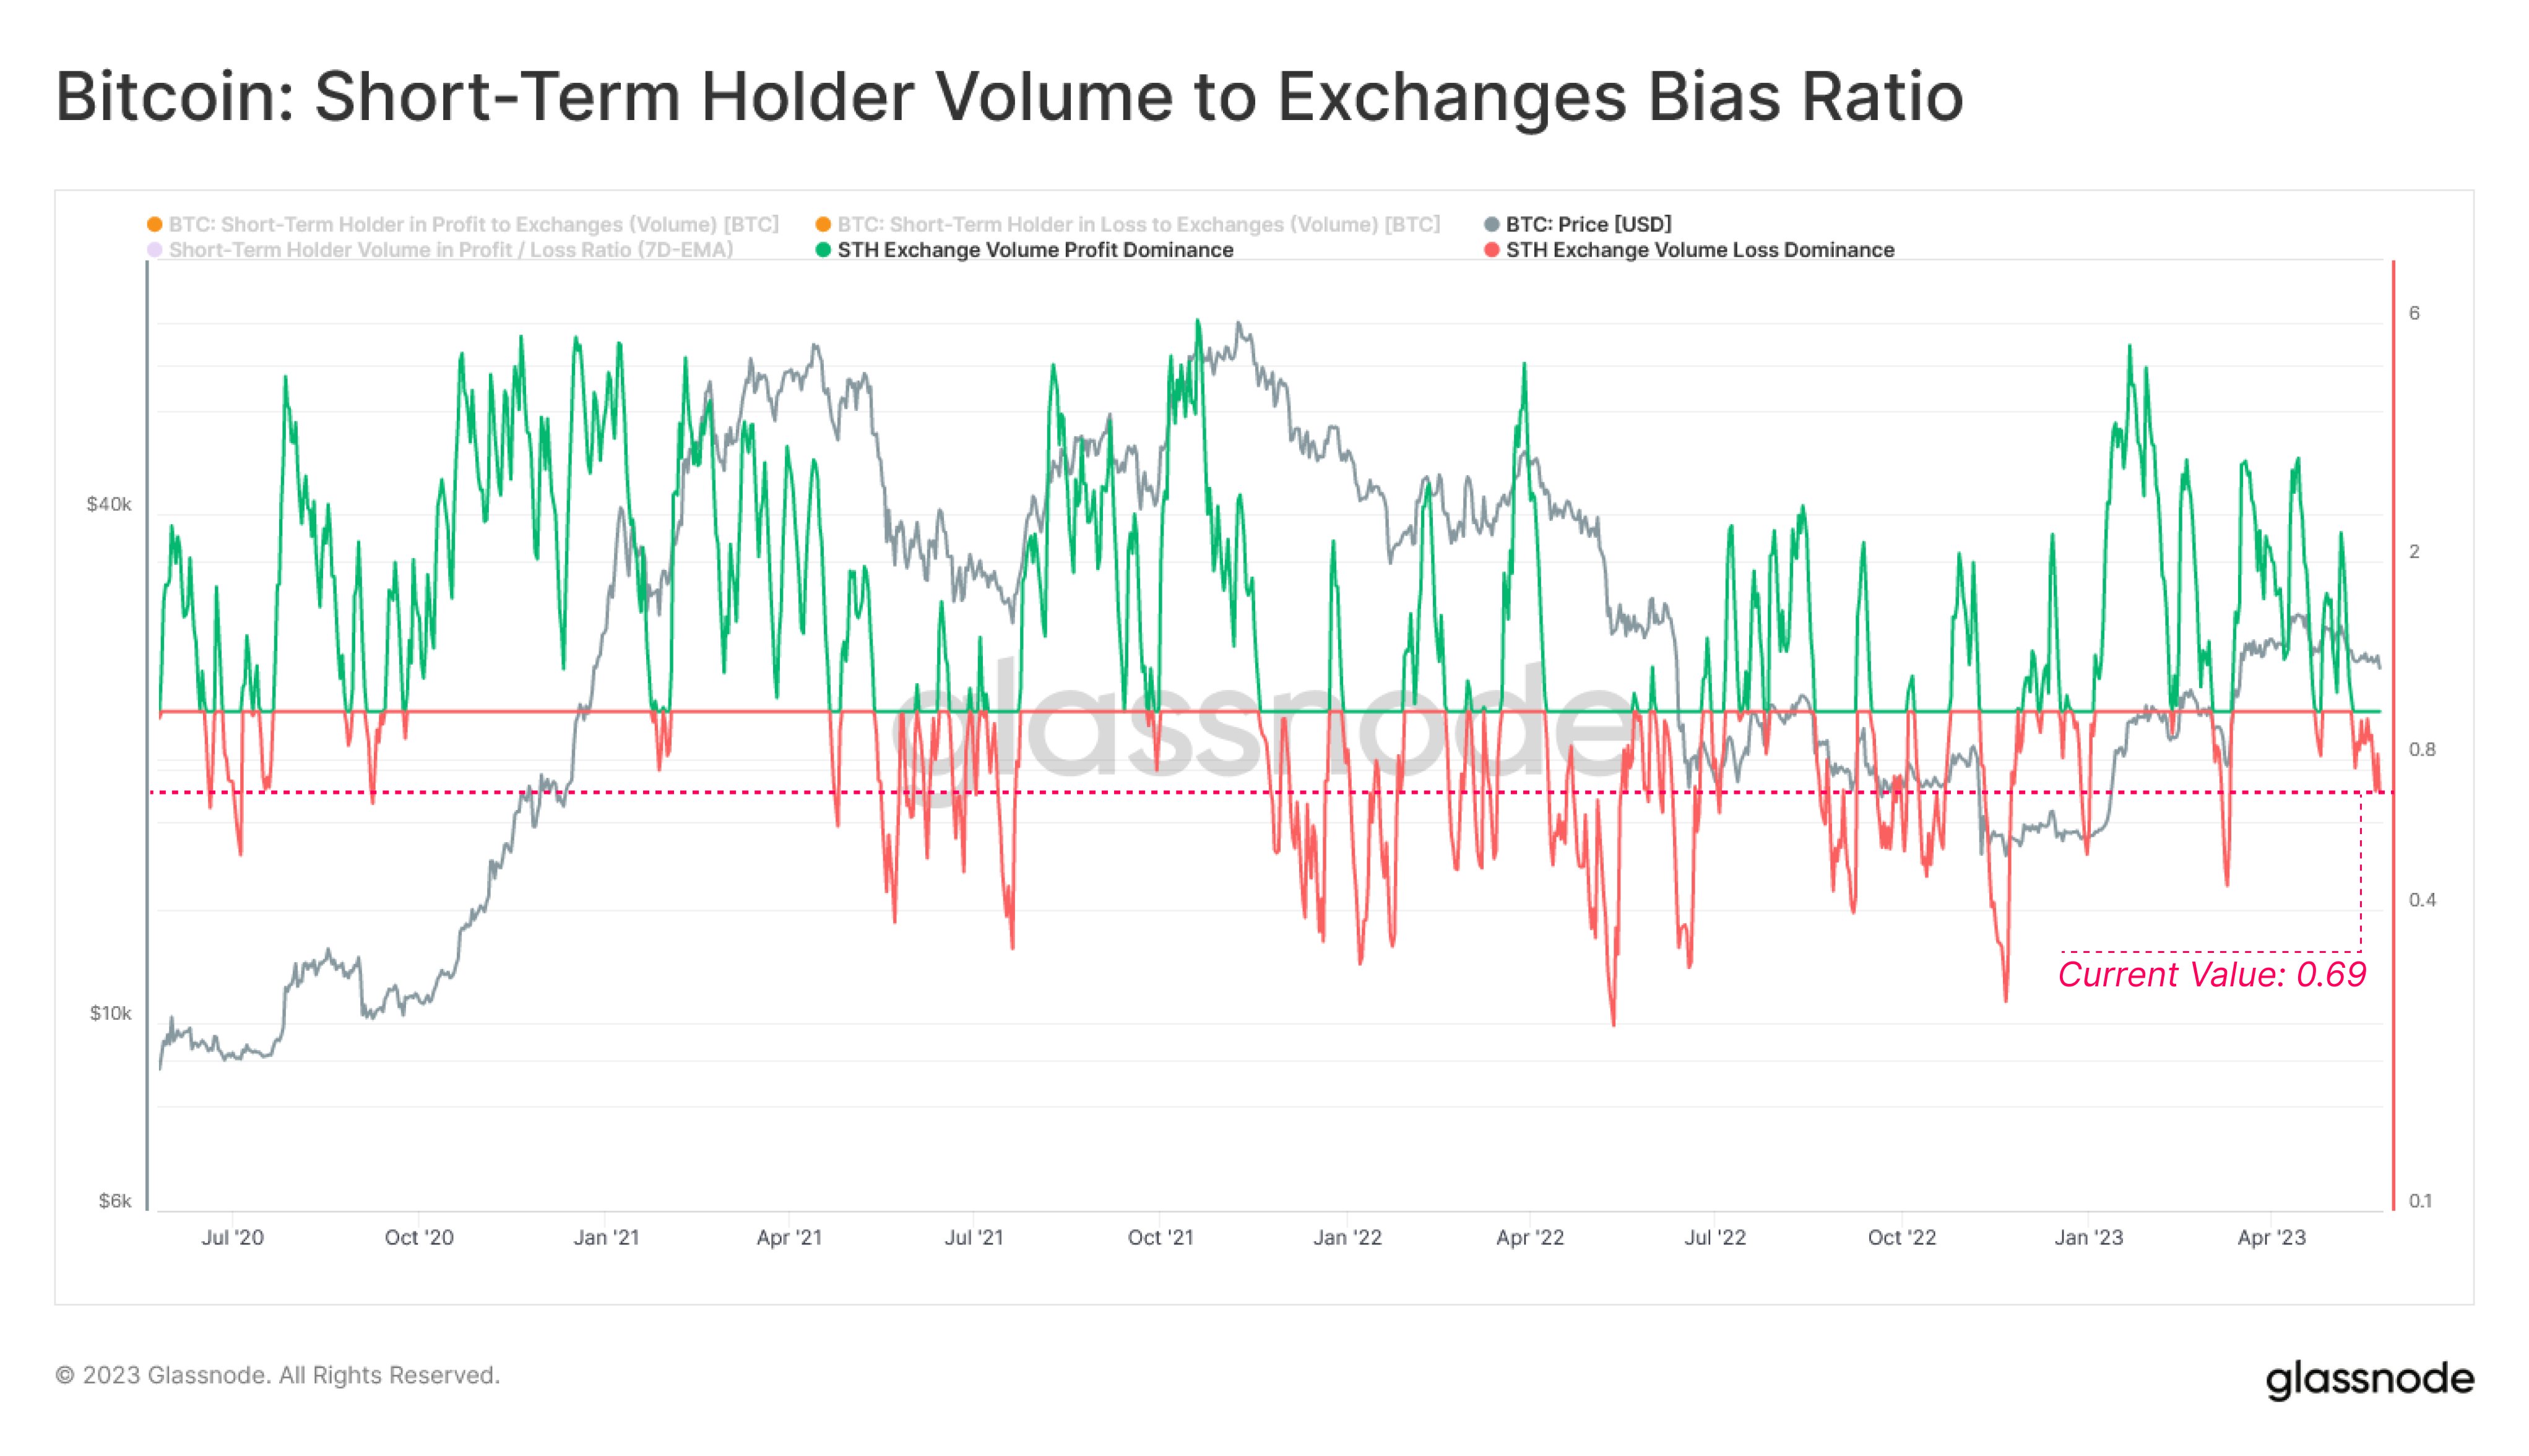
This group seems to have a heavy loss bias currently | Source: Glassnode on Twitter
Interestingly, the indicator’s value for the STHs is 0.69, which is almost exactly the same as the average for the entire market. This would mean that the LTHs have contributed relatively little to selling pressure recently.
The STHs selling right now would be the ones that bought at and near the top of the rally so far and their capitulation may be a sign that these weak hands are currently being cleansed from the market.
Although the indicator hasn’t dipped as low as in March yet, this capitulation could be a sign that a local bottom may be near for Bitcoin.
BTC Price
At the time of writing, Bitcoin is trading around $26,400, down 1% in the last week.

BTC has struggled recently | Source: BTCUSD on TradingView
Featured image from 愚木混株 cdd20 on Unsplash.com, charts from TradingView.com, Glassnode.com


